SUSTAINABLE BUDGET
The 2026–27 Budget delivers a sustainable fiscal position by maintaining operating surpluses while continuing to invest in key services and infrastructure.
The government is forecasting a net operating surplus in 2025–26 as well as surpluses across all years of the forward estimates, ensuring that operating expenses are funded from revenues. This approach is supported by disciplined fiscal targets, including limiting expenditure growth to align with household income growth, and maintaining debt at sustainable levels over time.
A key element of sustainability is the government’s restraint on spending growth and focus on improving public sector productivity. Agencies will pursue efficiency measures including reducing non-frontline costs over time. To this end, the government will implement a 12-month partial freeze on non-frontline recruitment to reduce costs. Under this measure, only one in every two vacancies can be recruited, still enabling key positions to be filled.
The budget does not introduce any new taxes or tax increases.
The government manages debt carefully by investing in productivity-enhancing infrastructure projects, while ensuring debt remains manageable over the medium term. While net debt increases to deliver key infrastructure such as the North-South Corridor, River Torrens to Darlington project, and the new Women’s and Children’s Hospital, the debt-to-revenue ratio is lower over the forward estimates than projected in the 2025-26 Budget.
Overall, this strategy supports economic growth and service delivery while maintaining long-term fiscal sustainability.
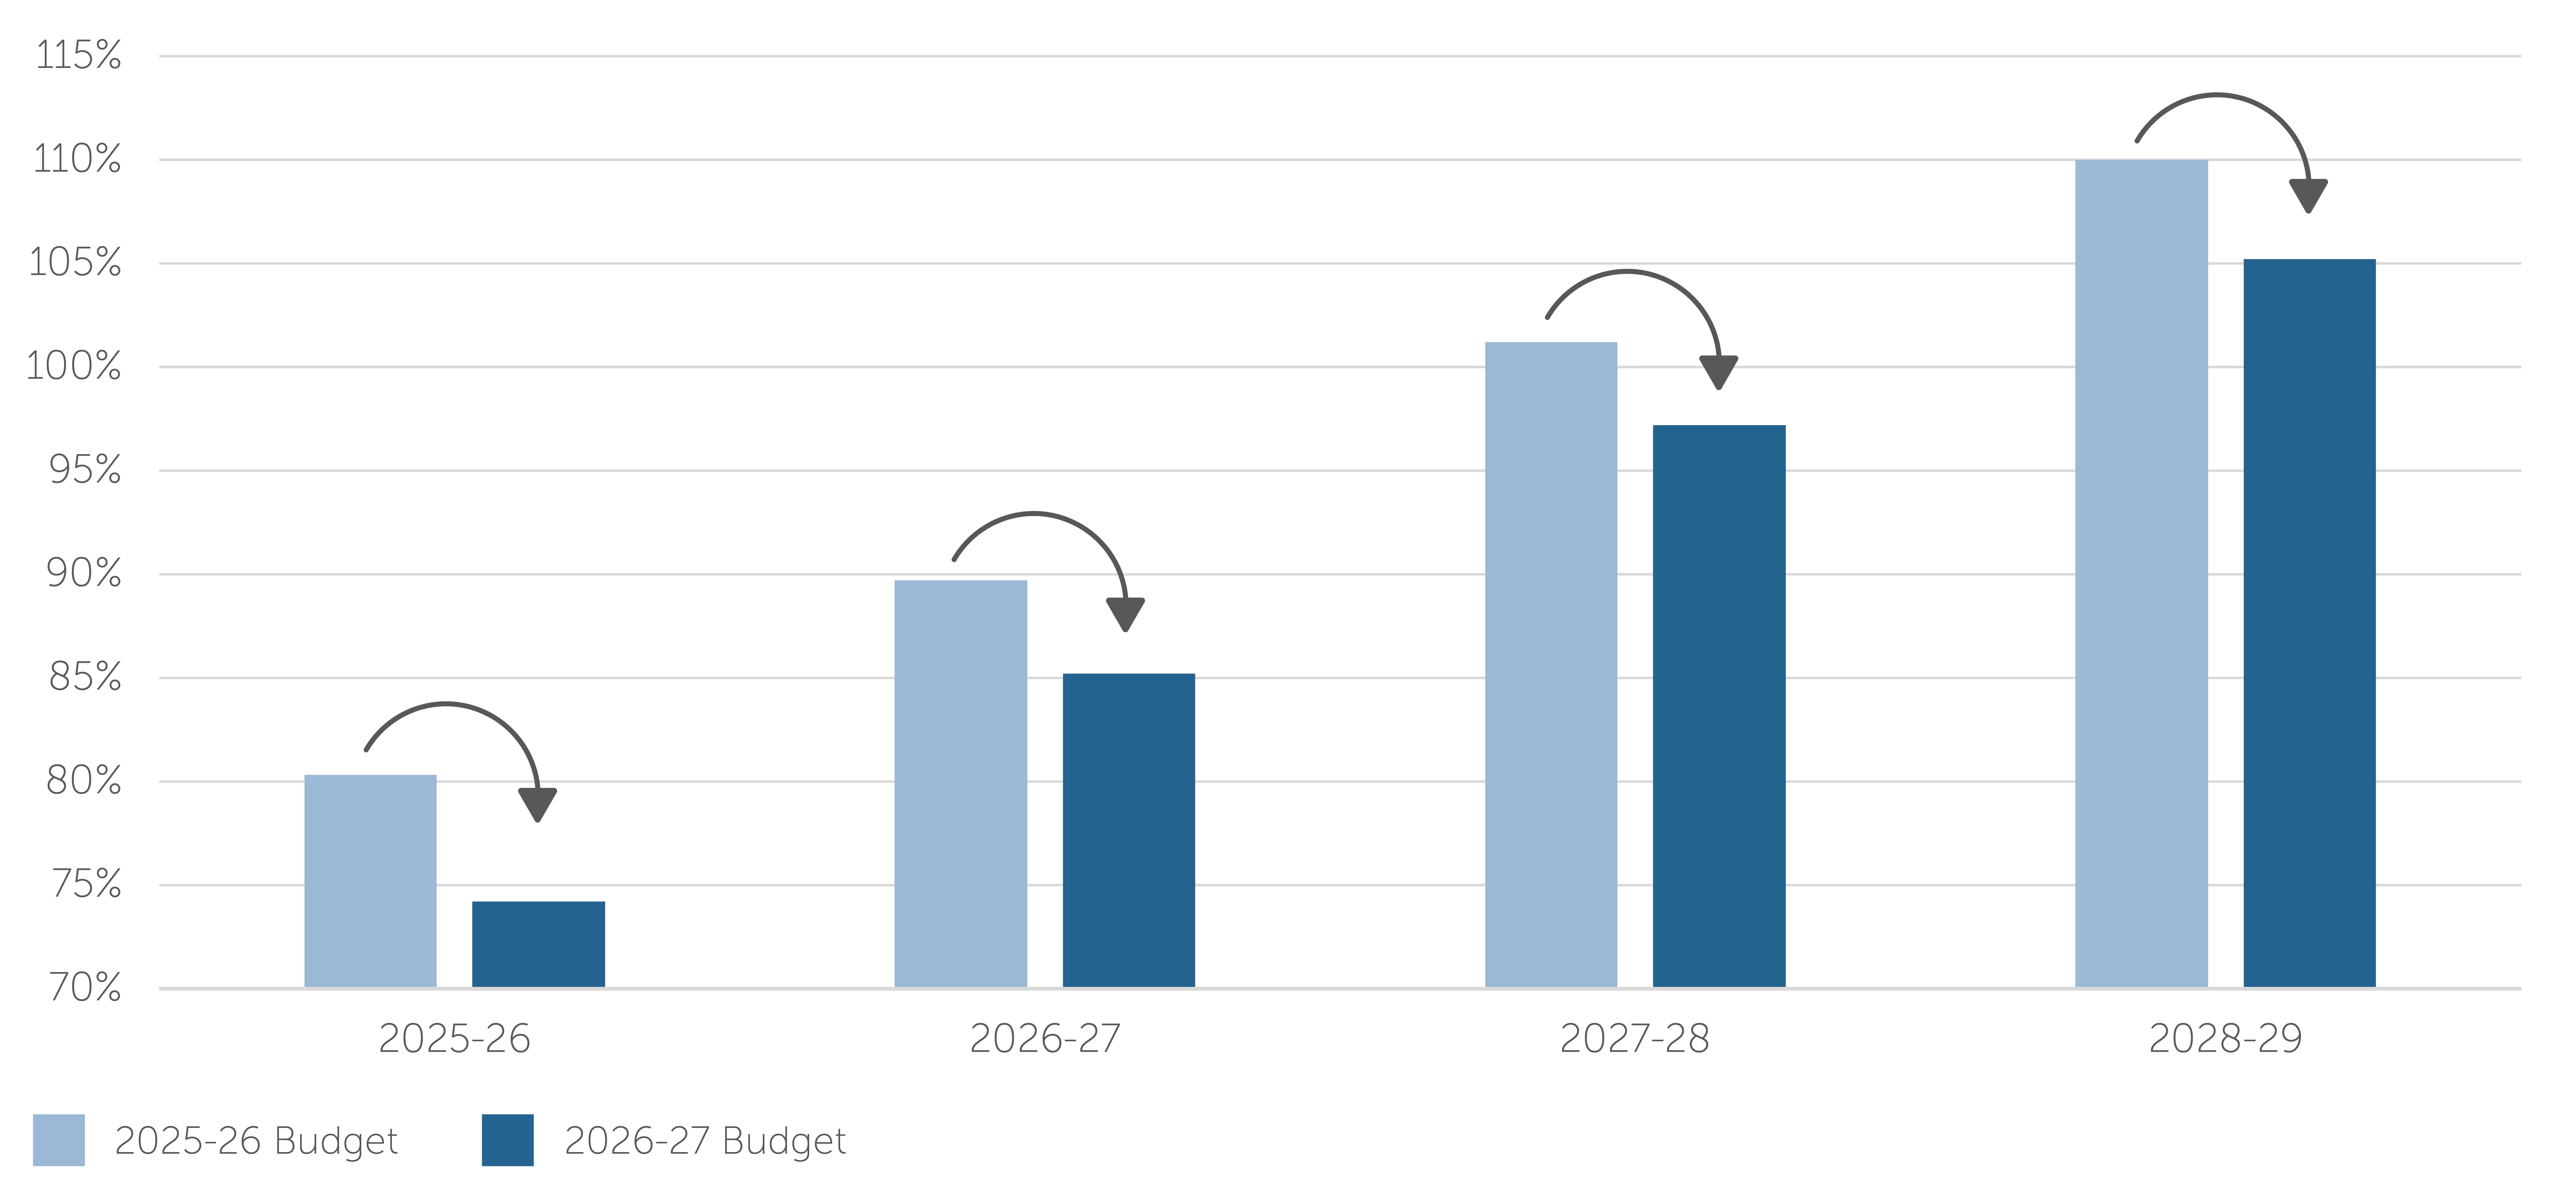
GENERAL GOVERNMENT SECTOR NET DEBT TO REVENUE RATIO
ECONOMIC OVERVIEW
South Australia’s economy has performed strongly in 2025-26, supported by nation leading growth in state final demand, driven by public investment and consumption, private new capital expenditure and private investment in new dwellings. Agricultural production and exports have recovered following previous drought conditions, supporting stronger growth in Gross State Product in 2025-26.
Employment has grown substantially faster than previously forecast, with strong participation and an ongoing low unemployment rate. South Australia’s unemployment rate has been in line with, or below, the national rate in recent years. Net overseas migration, while slowing over the past year, continues to drive population growth.
While there are headwinds from the conflict in the Middle East, the state is facing these from a position of strength. Temporary higher inflation is expected to reduce growth by a quarter of a percentage point in 2026-27. Inflation is forecast to return to the Reserve Bank of Australia’s target range by the June quarter 2027, in line with Commonwealth Budget forecasts.
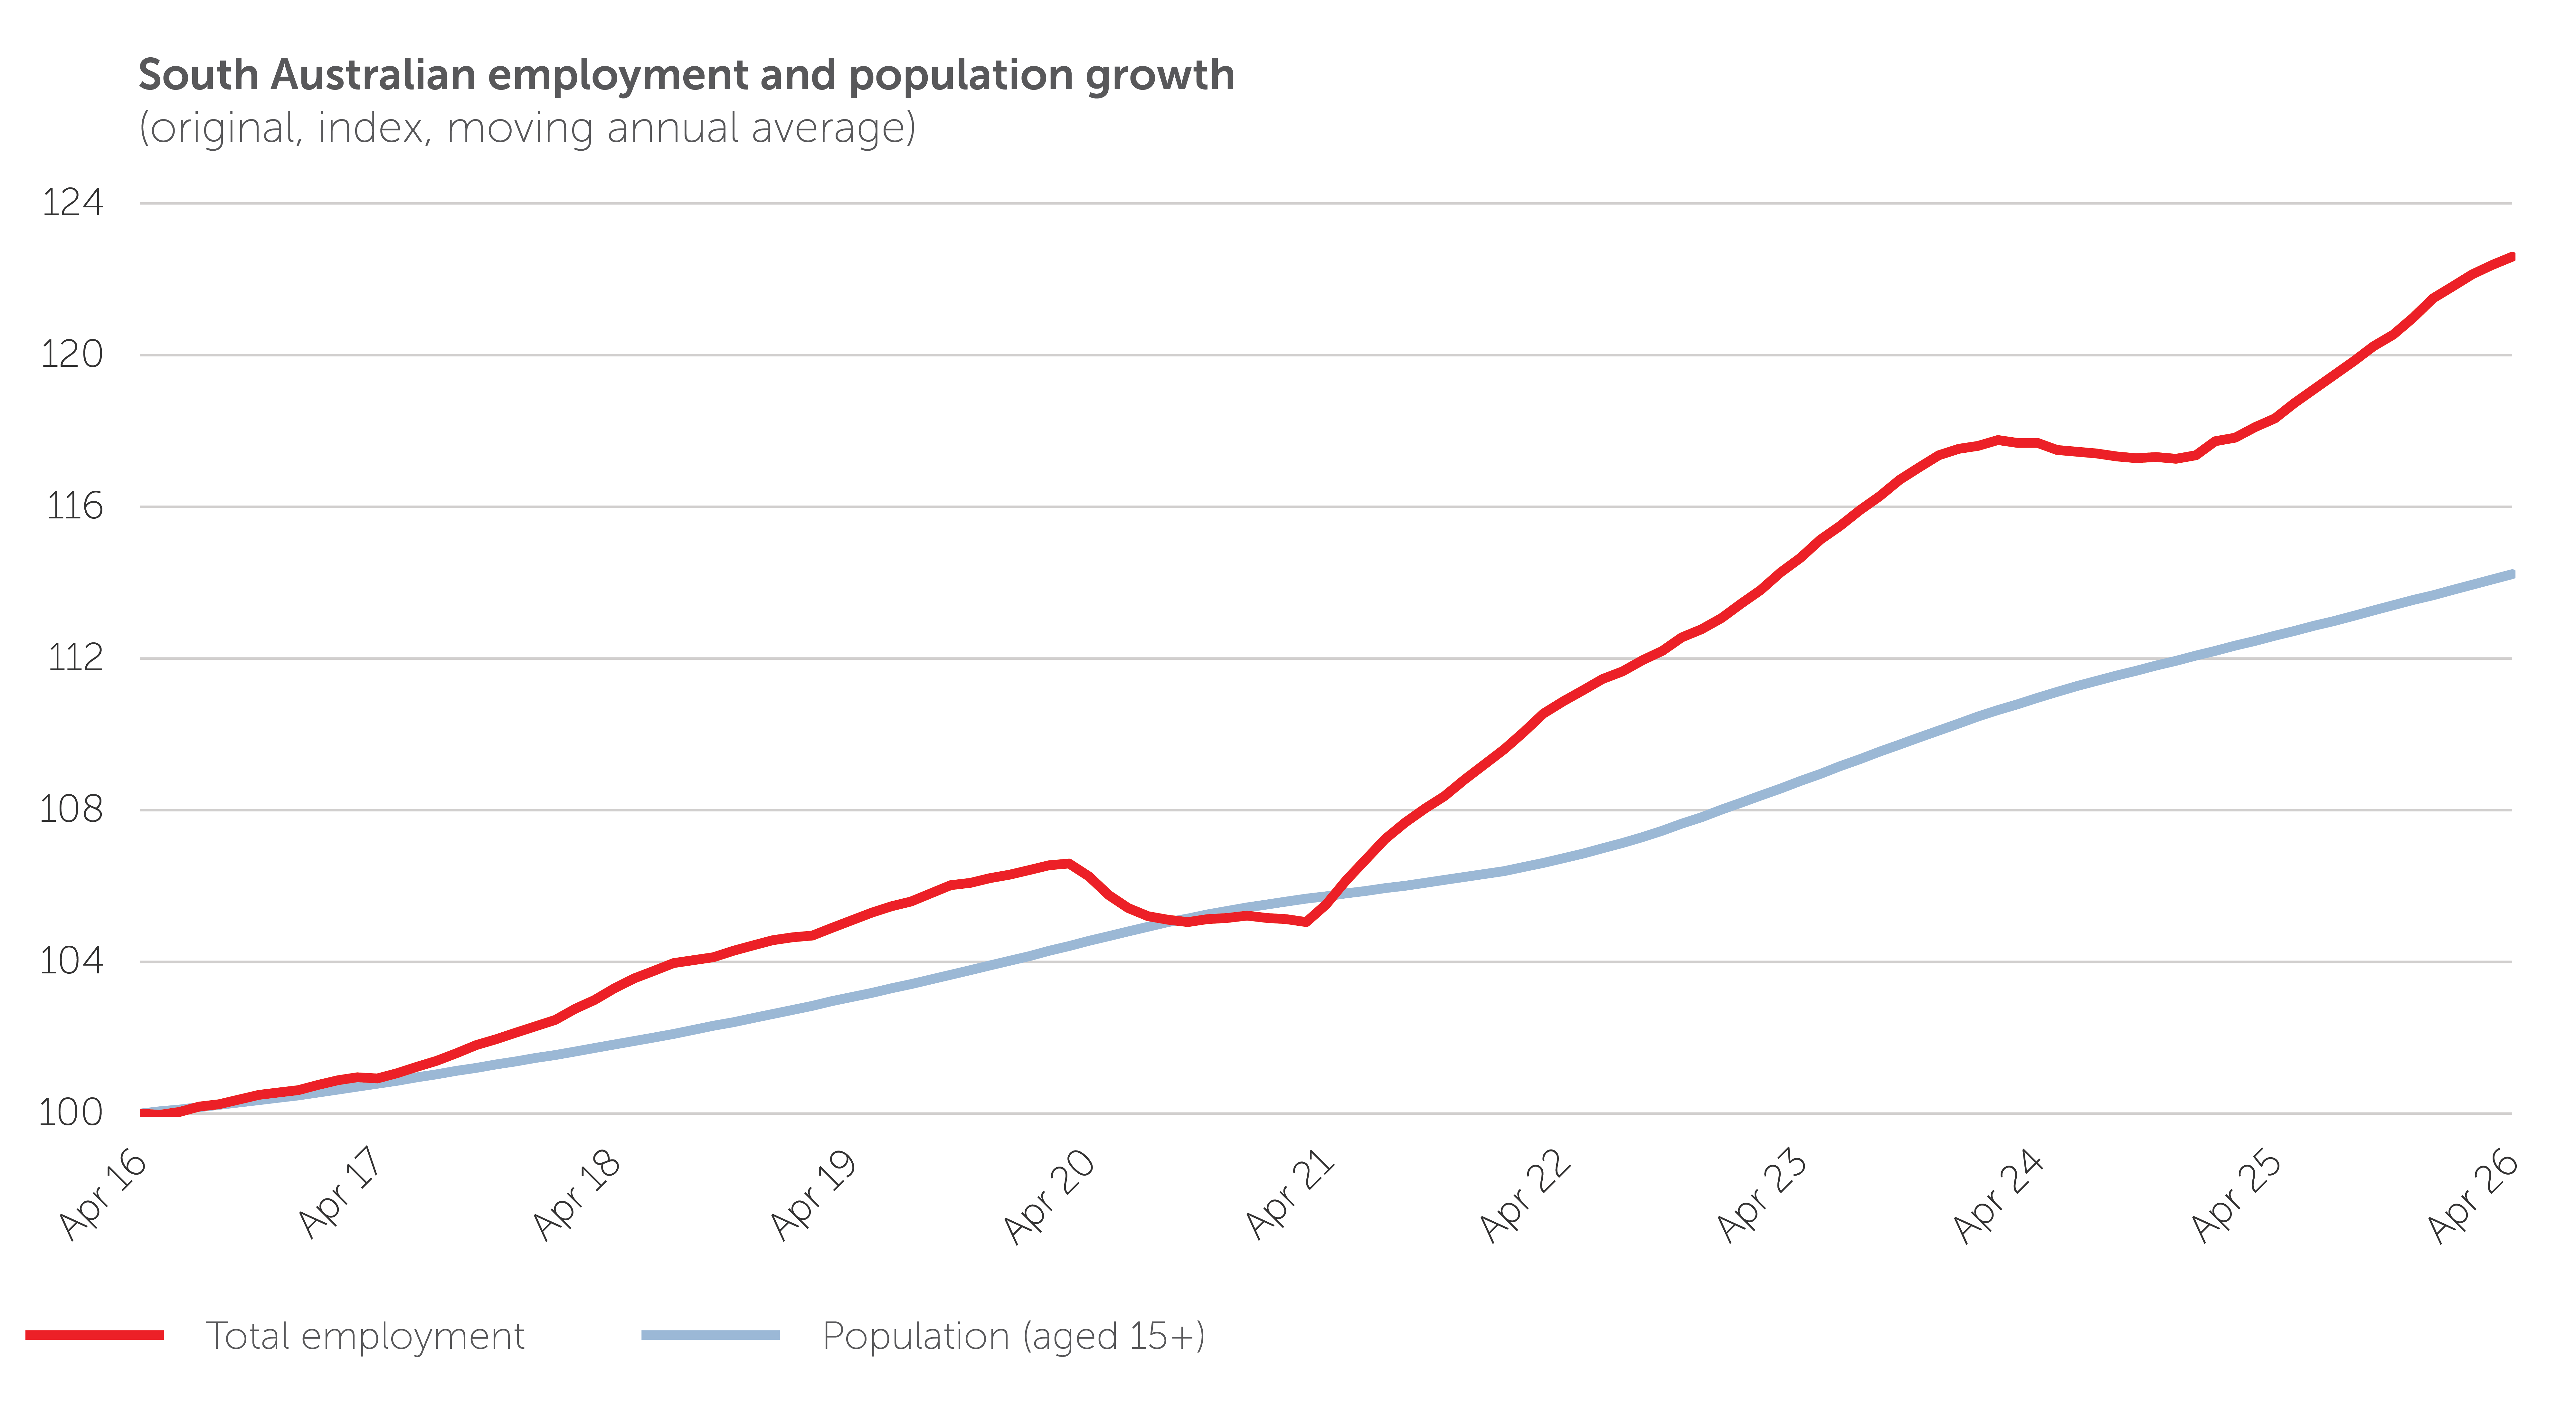
EMPLOYMENT GROWTH HAS OUTPACED POPULATION GROWTH
KEY ECONOMIC INDICATORS UNDERLYING THE BUDGET AND FORWARD ESTIMATES
– SOUTH AUSTRALIA
| 2025-26 Estimate | 2026-27 Forecast | 2027-28 Projection | 2028-29 Projection | 2029-30 Projection | |
|---|---|---|---|---|---|
| Gross State Product – real growth (%) | 2¼ | 1¾ | 2 | 2¼ | 2 |
| State Final Demand – real growth (%) | 3¼ | 1¾ | 2 | 2¼ | 2 |
| Employment – growth (%) | 3¼ | 1 | 1 | 1 | 1 |
| Adelaide CPI (%) | 3¾ | 3½ | 2½ | 2½ | 2½ |